U.S. solar energy companies
Solar Growth and the ITC
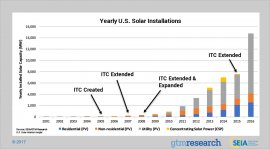
The Solar Investment Tax Credit (ITC) has provided industry stability and growth since its initial passage in 2006. In the last decade, solar has experienced an average annual growth rate of 68%. To learn more about the ITC and its impact on the solar industry, visit our ITC Policy Page.
Growth in Solar is led by Falling Prices
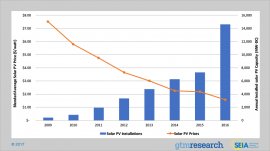
The cost to install solar has dropped by more than 70% since 2010, leading the industry to expand into new markets and deploy thousands of systems nationwide.
Solar's Share of New Capacity has Grown Rapidly
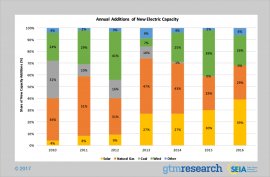
In 2016, Solar installed 39% of all new electric generating capacity, topping all other technologies for the first time. Solar’s increasing competitiveness against other technologies has allowed it to quickly increase its share of total U.S. electrical generation- from just 0.1% in 2010 to 1.4% today. By 2020 solar should surpass 3% of total generation is expected to hit 5% by 2022.
U.S. Solar Market Through Q1 2017: Key Takeaways
2, 044 MW installed in Q1 2017
6th consecutive quarter over 2 GW
Down 2% from Q1 2016
Nearly 45 GW of total solar capacity now installed
 Average Annual Growth Rate of 68% over last 10 years
Generates enough electricity to power 8.7 million homes
Solar accounted for 30% of all new capacity installed in Q1 2017
Second to only Natural Gas which accounted for 41%
Builds upon strong 2016 in which Solar accounted for 39% of all new capacity, ranking 1st
Solar prices dropped 19% over the last 12 months Price drop is seen across all market segments, led by reduced hardware costs Prices have dropped 63% over the last 5 years Utility-scale PPAs now signed for $0.03 - $0.05/kWhThere are now nearly 1.4 million solar installations in the U.S.
After reaching 1 million in 2016, 2 million should be hit in 2018 and 4 million by 2022
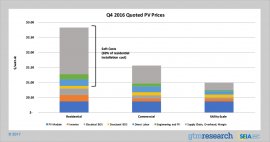
Solar PV Price Breakdown
The biggest cost-decline opportunity in the solar industry exists in soft costs, including labor, supply chain and overhead considerations. The U.S. Department of Energy is leading the charge on reducing soft costs, and SEIA and The Solar Foundation are working with cities and counties to streamline permitting processes and reduce local barriers to going solar.
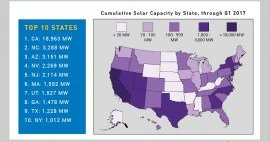
The U.S Solar Industry is a 50 State Market
While California has traditionally dominated the U.S. solar market - with 35% market share in 2016 - other markets are continuing to expand, including Minnesota, Utah, Florida and Texas. As the price of solar continues to fall, new markets will grab an increasingly large share of the market.
New Market Opportunities for Distributed Solar
After years of 50%+ annual growth, the residential market growth has slowed in a handful of mature markets as installers trial new sales techniques. But growth in emerging markets like Utah, Texas, South Carolina and Florida should help the national residential market grow in 2017. Meanwhile, the rapid rise of community solar has boosted the non-residential segment in 2016 and 2017, coupled with increasing numbers of both off-site and rooftop corporate procurement by such companies as Walmart, Apple, Target and Amazon.
Utility-Scale Solar Pipeline
In 2016, 72% of all solar capacity installed was utility-scale, and this segment should account for at least two-thirds of all solar capacity again in 2017. While more than a third of the contracted pipeline will be completed in 2017, procurement is again ramping up and will lead to a resumption of utility-scale growth by 2019.
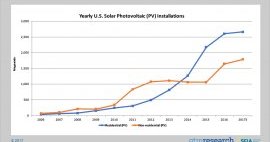
U.S. Solar PV Growth Forecast
While 2017 installations are expected drop slightly from a record-shattering 2016, the 12.6 GW expected still almost doubles 2015, the second largest year on record. After rapidly completing a record buildout in 2016 and 2017, developers will be looking to procure new projects with completion targets moving into the next decade. By 2021 there will be over 100 GW of solar installed in the U.S., with annual totals approaching 18 GW in 2022.
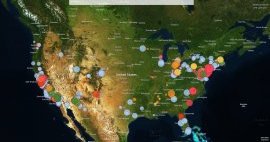
Solar Helps Fortune 500 Companies Save Money
Data from SEIA's annual Solar Means Business report show that major U.S. corporations, including Target, Walmart and Apple are going solar at an incredible rate. The top 25 corporate solar users in America have installed nearly 1, 100 MW of capacity at 2, 000 different facilities across the country as of October 2016.
Other key takeaways:
The amount of solar installed at U.S. corporations and businesses is enough to offset 1.1 million metric tons of carbon dioxide emissions each year Commercial prices have fallen by 58% since 2012 and by 16% in the last year